Project case study
Finance · 2025
Water Rebate Cost-Benefit Analysis with Monte Carlo Risk Modeling
Python cost-benefit and uncertainty analysis comparing high-efficiency toilet (HET) and smart irrigation controller (SIC) rebate programs, producing per-rebate and program-level NPV metrics with Monte Carlo sensitivity modeling.
Highlights
- Built a deterministic CBA engine that computes per-rebate savings, PV savings, NPV, B/C ratio, payback, ROI, and gallons-per-dollar for HET vs SIC vs status quo.
- Scaled results to a one-year cohort program snapshot using eligible-household counts and annual adoption rates to estimate program PV savings, program NPV, and annual gallons saved.
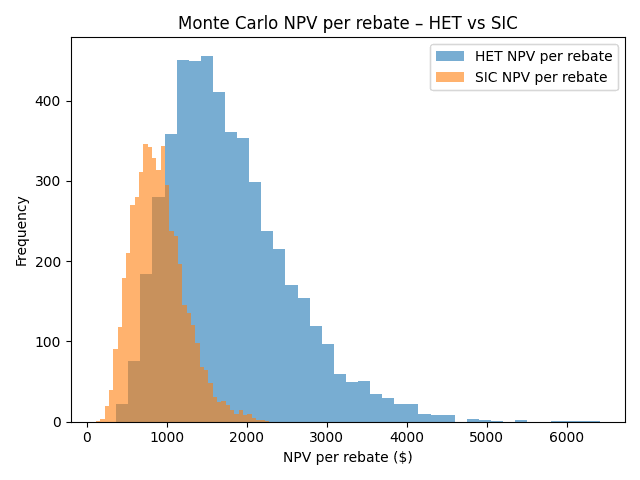
- Implemented a Monte Carlo risk model with triangular parameter sampling plus water-price escalation and SIC climate variability to quantify distributional outcomes and P(NPV > 0).
Gallery
What
Built a Python-based cost-benefit framework to compare two water conservation rebate programs: high-efficiency toilets (HET) and smart irrigation controllers (SIC), against a status quo baseline.
Extended the deterministic analysis with a Monte Carlo uncertainty model to quantify risk, variability, and the probability of positive NPV under realistic parameter uncertainty.
How
Loaded a structured assumptions table and computed per-rebate economics including annual realized gallons saved (with rebound factors), annual dollar savings, present value savings via annuity factors, NPV, B/C ratio, payback, ROI, and gallons-per-dollar.
Scaled per-rebate outputs into a one-year program snapshot using eligible-household counts and annual adoption rates to estimate total program cost, program PV savings, program NPV, and annual water savings.
Ran Monte Carlo simulations by sampling each assumption from triangular distributions (low/central/high), adding water price escalation via a growing-annuity PV factor, and applying a SIC-only climate factor to reflect outdoor variability.
Summarized outcome distributions with mean, percentiles, and P(NPV > 0), and generated histograms for both per-rebate and program-level NPVs.
Results
Produced a reproducible decision-support pipeline that reports both point-estimate CBA metrics and full uncertainty distributions for HET and SIC program options.
Enabled threshold-based policy interpretation using probability-of-positive-NPV and percentile bands to compare risk-adjusted performance across rebate alternatives.
Delivered modular scripts (deterministic + Monte Carlo) that can be extended with additional technologies, alternative adoption assumptions, or expanded scenario ranges.